


Summary
Several large-scale screening trials evaluating native and introduced herbaceous ground covers have been conducted in the last half century. Most trials have used shade cloth to evaluate growth of potted plants under moderate shade (45 to 55 percent of full sunlight) similar to what might be found in many agroforestry practices and heavy shade (20 to 30 percent of full sunlight) similar to what might be found in a well managed hardwood forest. It is difficult to compare results from different trials because there are few species in common, variable environments, and different harvesting times. Most of the larger screening trials appear to have included herbaceous forbs and grasses spanning the shade tolerance range from very tolerant to intolerant species. Using data from published and unpublished reports, we determined a percentile value for each species from the most shade intolerant (value = 0) to most shade tolerant (value = 100) within each screening trial. Percentile values were averaged across multiple screening trials to determine relative ranking of forty-five introduced and native herbaceous forbs and grasses. In general, cool-season forages tend to be more shade tolerant than warm-season forages with some exceptions such as eastern gama grass and the native tickclovers.
Introduction
Several agroforestry practices such as alley-cropping and silvopasture involve managing a ground cover under increasingly reduced sunlight as tree canopies develop. In open-crowned tree crop species like black walnut or honeylocust, as much as fifty percent of the sunlight may reach the understory ground cover. With other hardwoods, light intensities as low as five percent of full sunlight have been reported for deeply shaded, regenerating hardwood stands to thirty five percent for mature mixed hardwood forests (Small and McCarthy 2002).
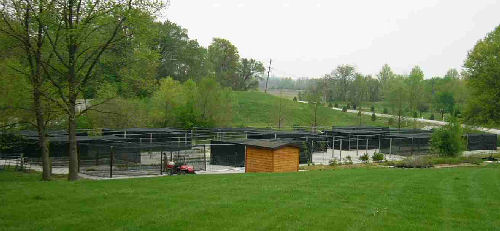
Unfortunately, there are only a few published studies that have examined the shade tolerance of forage legumes or grasses and even fewer that have included native legumes and grasses as candidate species. In addition, most screening trials have not used similar procedures or a standard experimental design. For example, Watson and others (1984a) covered field plots with 50 and 75 percent shade fabric while Lin and others (1999) grew their plants in closely-spaced pots set in hoophouses covered with 50 and 80 percent shade fabric. Subsequently, screening trials at the University of Missouri Center for Agroforestry have used widely-spaced black or white pots set on gravel inside large rectangular frames covered with 55 and 80 percent shade fabric (figure 1). Although all studies have demonstrated differences in shade tolerance for biomass production among herbaceous legumes and grasses, it is difficult to compare reductions in biomass yields across screening trials.
The objective of our paper is to test the suitability of calculating a percentile value for each species within a screening trial and then using these values to determine relative rankings across multiple screening trials. This technique may be most useful when screening trials evaluate a large number of different ground covers that include species with lower shade tolerance, i.e., a perennial warm-season prairie or savanna grasses, and species with excellent shade tolerance such as woodland or forest grasses and legumes.
Materials and Methods
Six research papers were found that reported growth and biomass yields of seventeen to thirty species grown under heavy shade (20 to 30 percent sunlight), moderate shade (45 to 55 percent sunlight), and full sunlight (Blackman and Wilson 1951b, Blackman and Black 1959, Watson and others 1984a, 1984b, Lin and others 1999, 2001). In addition, the University of Missouri Center for Agroforestry has completed three additional screening trials during the last decade. Most studies have used potted plants grown with irrigation and a fertile, well-drained potting medium to better assure that light will be the factor limiting plant growth. The following paragraphs briefly describe the experimental approaches used in these published and unpublished screening trials.
Blackman and Wilson (1951a) initiated a series of shade tolerance trials to evaluate relative growth rates that included five grasses, five legumes, and two non-legume forbs listed in Table 1. Four to seven seedlings were started in 10-inch-diameter pots under full sunlight. When seedlings started their rapid vegetative growth stage, pots were set inside small wooden shade structures that reduced light to 24, 50, and 100 percent of full sunlight. Plants were acclimated to the shade environments for 7 to 14 days before half the plants were washed from the soil to determine initial dry weight (roots, leaves, and shoots) and 10 to 14 days later when the other half of the plants were harvested. We obtained the mean relative growth rate as gram/gram/day from published results for each light intensity and screening trial (Blackman and Wilson 1951b, Blackman and Black 1959). For our paper, their relative growth rates for each experiment and species were combined and analyzed as a single screening trial.
Watson and others (1984a, 1984b) evaluated three grasses and eighteen legumes in direct-seeded 6-foot-long row plots established on a prepared seedbed. Plots were established in late fall and harvested the following spring. Individual rows were left uncovered or covered with either 50 or 75 percent shade fabric. Harvest data by forage species as reported in Watson and others (1984b) were treated as a single screening trial for our statistical analyses.
In summer 1994, Lin and others (1999, 2001) evaluated fourteen grasses and fifteen legumes. Plants were established in 2-gallon black plastic pots filled with a pine bark, peat moss, vermiculite, perlite, and sand (0.5, 0.2, 0.2, 0.05, and 0.05 by volume, respectively) potting mix supplemented with micronutrients, urea, and a slow-release 13N-13P-13K fertilizer. Potted plants were either set in full sun adjacent to a 30-foot-wide hoophouse or inside the hoophouse under either 50 or 80 percent black shade fabric. Nominal spacing between pots was 1.5 by 1.5 foot that resulted in minor shading of the smaller plants and considerable shading of the black pots. Biomass was harvested in the fall before discarding plants. The entire experiment was replicated in spring 1995 to determine biomass yields for a summer harvest. Biomass yields as reported in Lin and others (1999) for the fall 1994 and summer 1995 harvests were treated as two screenings for our statistical analyses.
For the screening trials completed by the University of Missouri Center for Agroforestry from 1997 to 1999, thirteen grasses and seven legumes were evaluated. Seed for each species was sown in early spring in germination trays and set in a heated greenhouse with a 16-hour photoperiod. Three to four weeks later, plantlets were transplanted to 3-inch square plastic plots. In June, three plants were transplanted to 8-inch wide, 2-gallon black plastic pots filled with the same potting mix as in the preceding paragraph. Six pots of each species were set inside of one of nine 16 feet wide by 48 feet long by 8 feet high rectangular frames set on light-colored gravel. Three frames were left uncovered, three frames were covered with 55 percent black shade fabric, and three frames were covered with 80 percent black shade fabric. Pots were set 1.5 feet apart within a species row and 2.5 feet between rows. Pots were time watered once a day using drip irrigation. Above-ground biomass was harvested leaving a 2-inch stubble in early August and again in mid-October before discarding plants. Biomass was air-dried in an unheated greenhouse until samples could be oven-dried at 140 degrees F for two to three days before determining dry weight. Biomass data from each summer, fall, and total annual harvest for each of three years were treated as separate screenings for our statistical analyses.
For the screening trials completed in 2000-2001, six grasses and eleven legumes were evaluated as seedling and established plants. All species were started from seed in 2000, transplanted to 3-inch pots, and then to 2-gallon pots using the above procedure, except 8-inch-wide white plastic pots were substituted for black pots. Plants were grown in the same potting mix, shade structures, and spacing as in the preceding paragraph. In November 2000, all pots were placed under white polyethylene foam and plastic sheeting and overwintered. In March 2001, all pots were returned back into the same shade structure and shade level as in the previous year. Above ground biomass was harvested for each species during the spring and summer when most established plants were in full flower and again in October for the final harvest. Biomass was oven-dried at 140 degrees F for two to three days before determining dry weight. Biomass data from spring, summer, fall, and total annual harvest from each year were treated as separate screenings for our statistical analyses.
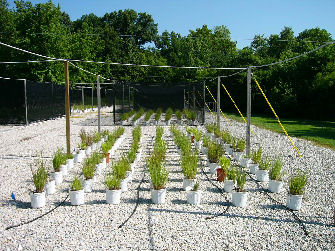
For the screening trials completed in 2005-2006, seven grasses including twenty-one accessions of big bluestem were evaluated with three species started from seed and four species started from dormant rhizomes. Plants were established in the greenhouse in 2-gallon white plastic pots using the above potting mix. Three potted plants of each species or accession were moved in June 2005 to one of fifteen 16 feet wide by 32 feet long by 8 feet high shade structures set on light-colored gravel (figure 2). Pots were set on 2.2- x 2.2-foot spacing. Using drip irrigation, potted plants were time-irrigated once or twice daily. Potted plants were over-wintered under white polyethylene foam and film and randomly set back into the fifteen structures in spring 2006. Above ground biomass leaving 3- or 6-inch stubble was harvested at the boot stage and again in November in both 2005 and 2006. Biomass was air-dried in an unheated greenhouse and then oven-dried at 140 degrees F for two to three days before determining dry weight and forage quality. Biomass data from spring boot, fall, and total annual harvest for each year were treated as separate screenings for our statistical analyses.
Biomass yields or relative growth rates from spring (March to May), summer (June to August), fall (September to November), and total annual yields were entered into an electronic spreadsheet by species and cultivar, light intensity, and screening year. Yields under moderate shade (40 to 60 percent full sunlight) and dense shade (20 to 30 percent full sunlight) for each species were converted to percent reduction from yields in full sunlight. For each screening trial, the species with the minimum and maximum percent reduction in biomass were identified for both shade levels. The percentile value for each species within each screening trial was determined as
(Test species % reduction in yield - Minimum % reduction in yield) x 100
(Maximum % reduction in yield - Minimum % reduction in yield)
where the species with the greatest yield reduction has a percentile value equal to zero and the species with the smallest yield reduction has a percentile value equal to 100 percent. If exceedingly shade-tolerant species were used that resulted in percentile gaps of 15 or more such as occurred with hog peanut, the species was assigned a value of 100 and deleted from that screening trial before recalculating percentile values. The average percentile value and standard deviation were determined for moderate shade and dense shade for each species that had been included in two or more screening trials.
Results and Discussion
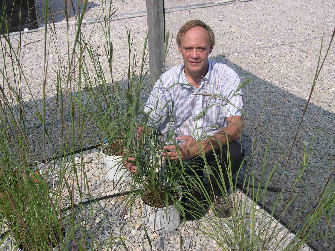
Traditionally, shade tolerance has been quantified by harvesting plant biomass at different light levels and converting yields to a percentage of the yield obtained under full sunlight. Using yields as a percent of yield under full sunlight, species within a screening trial can then be ranked for their shade tolerance. The same cannot be done across multiple screening trials because the choice of shading structure, potting media, spacing among plants and pots, and growth stage when harvested can strongly influence biomass yields. Watson and others (1984b) reported no species with greater yields under moderate shade than under full sunlight. Lin and others (1999) and Blackman and Wilson (1951) reported finding a few species with the greater yields under moderate shade than under full sunlight. In contrast, recent studies growing plants in widely-spaced black pots resulted in eighteen species with larger yields under moderate sunlight than under full sunlight. When the microenvironment alters plant growth, especially the plants under full sunlight, it further complicates making comparisons across screening trials (figure 3).
Percent reductions in biomass under moderate and heavy shade were obtained for four-five candidate ground cover species evaluated in two or more screening trials. No single plant species was evaluated in all screening trials so shade tolerance relative to a standard species can not be estimated. Normal ranking procedures of 1, 2, 3, etc. within a screening trial based on percent yield reduction assumes equal interval in rank between each species while values in percent yield reduction normally shows a normal distribution. Calculating shade tolerance as a percentile between the most and the least shade-tolerance species within a screening trial allows species percentile values to approximate a normal distribution between 0 and 100. In theory, percentile values can also be treated statistically in the same way as other normally distributed data to determine averages, standard deviations, and conduct analyses of variances.
Table 1 lists forty-five herbaceous species screened by one or more investigators relative to their average percentile value and standard deviation. Many species have standard deviations nearly as large as their average percentile value indicating substantial variation existed across the different screening trials. Time of the year and growth stage when harvested appear to be significant sources of variation. For instance, cool-season forages tend to show a higher percentile value from a spring harvest than from a fall harvest. Heat-stress appears to be another significant source of variation, especially for container-grown plants. Mathers (2003) reported temperatures lethal to plant roots with the soil along the south-side of pots exposed to direct sunlight. This effectively reduces the pot volume and can reduce above ground biomass as plant roots continually try to colonize the soil that has been called a "zone of death". Our screening trials suggest when pots are widely-spaced, plants in the full sun treatment in white pots probably suffer less heat-stress than those in black pots. Finally, percentile values within a screening trial are dependent on having species that are very shade tolerant and shade intolerant to anchor the ends of the distribution which may not always have been the case.
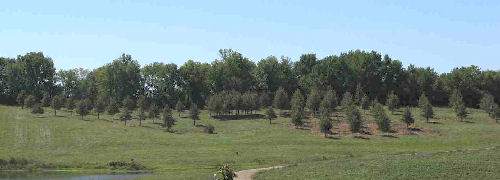
Our experiences evaluating shade tolerance of candidate ground covers for agroforestry plantings have lead to several recommendations and raised several important unanswered questions. Easily propagated perennial forages need to be identified that can anchor the ends of percentile distribution. Use of perennial species allows us to evaluate for differences in shade tolerance of plants as seedlings and again as established plants. Candidate species that will survive between 20 and 100 percent of full sun could include hoary tickclover or crownvetch on the very shade-tolerant end and switchgrass or prairie cordgrass on the very shade-intolerant end. Additional approaches besides using light-colored or light-reflecting pots to minimize heat-stress of widely-spaced, container-grown plants need to be evaluated such as larger pots, especially when evaluating established perennial forages, or pot-in-pot systems (Mathers 2003). In addition, plant responses in controlled shade environments need to be confirmed with field plantings under shade fabric and tree canopies where plants are exposed to other stresses in addition to reduced light (figure 4). Because of heat stress issues associated with exposed pots, preliminary results suggest that plants grown under light shade (65 to 75 percent of full sun) may give better estimates of maximum biomass yield than do plants grown under full sun.
The question of how well shade fabrics mimic natural shading under sunflecks and dense tree canopies remains to be answered. The red/far red light ratios under shade fabrics are much higher than under tree canopies. Preliminary results using irregular woven fabric producing a mix of very small patches of light and dense shade (averages 22 percent of full sunlight) to simulated light flecks indicated no differences in plant biomass from plants grown under 80 percent shade fabric (figure 5). Techniques for shading that produce larger sunflecks still need to be evaluated to address this question. Lastly, we may need to look at other statistical procedures besides ranking of percentile averages from multiple screenings to reduce variation and better estimate the relative ranking among native and introduced herbaceous forbs and grasses..
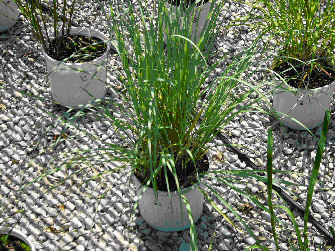
Table 1 - Mean value and standard deviation (number of trials) for percentile values under moderate shade (45 to 55 % full sun) and heavy shade (20 to 30 % full sun) for 45 introduced or native forage species.
|
Common name |
Phen. |
Study |
Mean Percentile Value z |
|
|
Moderate shade |
Dense shade |
|||
|
Hog peanut |
WSL |
L |
100 � 0 ( 2) |
100 + 0 ( 2) |
|
Strawberry clover |
CSL |
K |
85 + 20 ( 9) |
47 + 33 ( 9) |
|
Hoary tickclover |
WSL |
K, L |
81 + 36 (12) |
86 + 25 (12) |
|
Kura clover |
CSL |
N |
69 + 35 ( 5) |
56 + 39 ( 5) |
|
Cluster fescue |
CSG |
N |
69 + 28 (11) |
76 + 27 (11) |
|
Crimson clover |
CSL |
N, W |
67 + 40 ( 9) |
39 + 35 ( 9) |
|
River oats |
CSG |
N |
67 + 38 ( 6) |
83 + 19 ( 6) |
|
Paniculated tickclover |
WSL |
K, L |
64 + 25 (12) |
69 + 22 (12) |
|
Crownvetch |
CSL |
N |
61 + 16 ( 5) |
83 + 19 ( 5) |
|
Reed canary grass |
CSG |
K |
61 + 29 ( 9) |
69 + 11 ( 9) |
|
Kentucky bluegrass |
CSG |
K, L |
55 + 32 (12) |
60 + 26 (12) |
|
Eastern gama grass |
WSG |
N |
53 + 22 (24) |
63 + 27 (23) |
|
Subterranean clover |
CSL |
B, N, W |
52 + 31 (14) |
31 + 21 (14) |
|
Red clover |
CSL |
B, K, L |
50 + 31 (13) |
30 + 17 (13) |
|
Tall fescue |
CSG |
B, L, N |
50 + 32 (11) |
49 + 26 (11) |
|
Sericea lespedeza |
WSL |
K, L, W |
50 + 33 (15) |
25 + 31 (15) |
|
Orchard grass |
CSG |
B, K, L |
49 + 27 (17) |
66 + 24 (17) |
|
Sunflower |
WSF |
B |
48 + 22 (15) |
57 + 20 (15) |
|
Smooth brome grass |
CSG |
K, L |
48 + 31 (12) |
66 + 14 (12) |
|
Berseem clover |
CSL |
W |
47 + 40 ( 4) |
38 + 44 ( 4) |
|
Timothy |
CSG |
B, K, L |
43 + 17 (14) |
36 + 20 (14) |
|
Illinois bundle flower |
WSL |
K |
41 + 21 ( 9) |
69 + 22 ( 9) |
|
Alfalfa |
CSL |
B, L, N |
41 + 16 (19) |
20 + 14 (19) |
|
Buckwheat |
WSF |
B |
40 + 19 ( 6) |
47 + 15 ( 6) |
|
Birdsfoot trefoil |
CSL |
L, N |
39 + 27 (18) |
25 + 9 (18) |
|
Perennial ryegrass |
CSG |
B, L, N |
39 + 21 (10) |
44 + 15 (10) |
|
Canada wild rye |
CSG |
N |
39 + 9 ( 3) |
36 + 15 ( 3) |
|
Annual rye grass |
CSG |
B, K, W |
38 + 26 (15) |
47 + 29 (15) |
|
Alsike clover |
CSL |
B, L, N |
37 + 20 ( 8) |
22 + 18 ( 8) |
|
Creeping red fescue |
CSG |
N |
37 + 11 ( 5) |
27 + 7 ( 5) |
|
Big bluestem |
WSG |
L, N |
37 + 27 (27) |
41 + 30 (27) |
|
Redtop |
CSG |
K |
35 + 17 ( 9) |
41 + 19 ( 9) |
|
White clover |
CSL |
B, K, L |
35 + 24 (14) |
38 + 21 (14) |
|
Little bluestem |
WSG |
N |
33 + 14 ( 6) |
30 + 13 ( 6) |
|
Bermudagrass |
WSG |
K, L |
30 + 16 (10) |
44 + 39 (10) |
|
Bahia grass |
WSG |
K |
27 + 17 (21) |
42 + 19 (21) |
|
Striate lespedeza |
WSL |
L |
25 + 22 ( 3) |
36 + 16 ( 3) |
|
Cheat or downy brome |
CSG |
N |
24 + 11 ( 5) |
44 + 13 ( 5) |
|
Indian grass |
WSG |
L |
22 + 21 ( 2) |
24 + 4 ( 2) |
|
Arrowleaf clover |
CSL |
W |
18 + 21 ( 3) |
39 + 50 ( 3) |
|
Sainfoin |
CSL |
N |
17 + 20 ( 6) |
18 + 13 ( 6) |
|
Korean lespedeza |
WSL |
L, N |
17 + 15 ( 8) |
11 + 9 ( 9) |
|
Switchgrass |
WSG |
K |
14 + 14 (12) |
14 + 10 (12) |
|
Prairie cordgrass |
WSG |
K |
8 + 13 ( 6) |
8 + 7 ( 6) |
|
Prairie dropseed |
CSG |
N |
7 + 8 ( 6) |
4 + 8 ( 6) |
x Phenological classes: CSG = cool season grass, CSL = cool season legume, WSG = warm season grass, WSL = warm season legume, and WSF = warm season non-legume forb.
y Study design: B = widely spaced ceramic pots, K = widely spaced black pots; L = closely spaced black pots; N = widely spaced white pots; and W = field plots.
z Percentile values are averages with standard deviations from individual percentile values computed for each harvest and replication of screening trials by different study designs shown in parenthesis.
By J. W. Van Sambeek1, N. E. Navarrete-Tindall2, H. E. Garrett3, C.-H. Lin3, R L. McGraw4, and D. C. Wallace5
1Research Plant Physiologist, North Central Research Station, 202 Natural Resource Building; 2Senior Research Scientist, Plant Sciences Division, 203 Gentry Hall; 3Professor and Research Assistant Professor, respectively, UMC Center for Agroforestry, 203 Natural Resource Building; 4Associate Professor, Department of Agronomy, 208 Waters Hall, University of Missouri, Columbia, MO 65211; and 5NRCS State Forester, Natural Resource Conservation Service, 601 Business Loop 70W, Suite 270, Columbia, MO 65203.
Cited Literature
Blackman, G.E. and J.N. Black. 1959. Physiological and ecological studies in the analysis of plant environment. XI. A further assessment of the influence of shading on the growth of different species in the vegetative phase. Annals of Botany 23(89): 51-63.
Blackman, G.E. and G.L. Wilson. 1951a. Physiological and ecological studies in the analysis of plant environment. VI. The constancy for different species of a logarithmic relationship between net assimilation rate and light intensity and it ecological significance. Annals of Botany 15(57): 63-94.
Blackman, G.E. and G.L. Wilson. 1951b. Physiological and ecological studies in the analysis of plant environment. VII. An analysis of the differential effects of light intensity on the net assimilation rate, leaf-area ratio, and relative growth rate of different species. Annals of Botany 15 (59): 373-408.
Lin, H. C., R. L. McGraw, M.F. George, and H.E. Garrett. 1999. Shade effects on forage crops with potential in temperate agroforestry practices. Agroforestry Systems 44: 109-119.
Lin, H. C., R. L. McGraw, M.F. George, and H.E. Garrett. 2001. Nutritive quality and morphological development under partial shade of some forage species with agroforestry potential. Agroforestry Systems 53: 269-281.
Mathers, H.M. 2003. Summary of temperature stress issues in nursery containers and current methods of protection. HortTechnology 13(4): 617-624.
Small, C.J. and B.C. McCarthy. 2002. Effects of stimulated post-harvest light availability and soil compaction on deciduous forest herbs. Canadian Journal of Forest Research 32: 1753-1762.
Watson, V.C., C. Hagedorn, W.E. Knight, and H.A. Pearson. 1984a. Shade tolerance of grass and legume germplasm for use in southern forest range. Journal of Range Management. 37(3): 229-232.
Watson, V.C., H.A. Pearson, W.E. Knight, and C. Hagedorn. 1984b. Cool season forages for use in pine forests. In: Linnartz, N.E. and M.K. Johnson, eds., Agroforestry in the Southern United States (33rd Annual Forestry Symposium). Baton Rouge, LA: Louisiana Agricultural Experiment Station: 79-88.